Report Tab #1 - University Summary
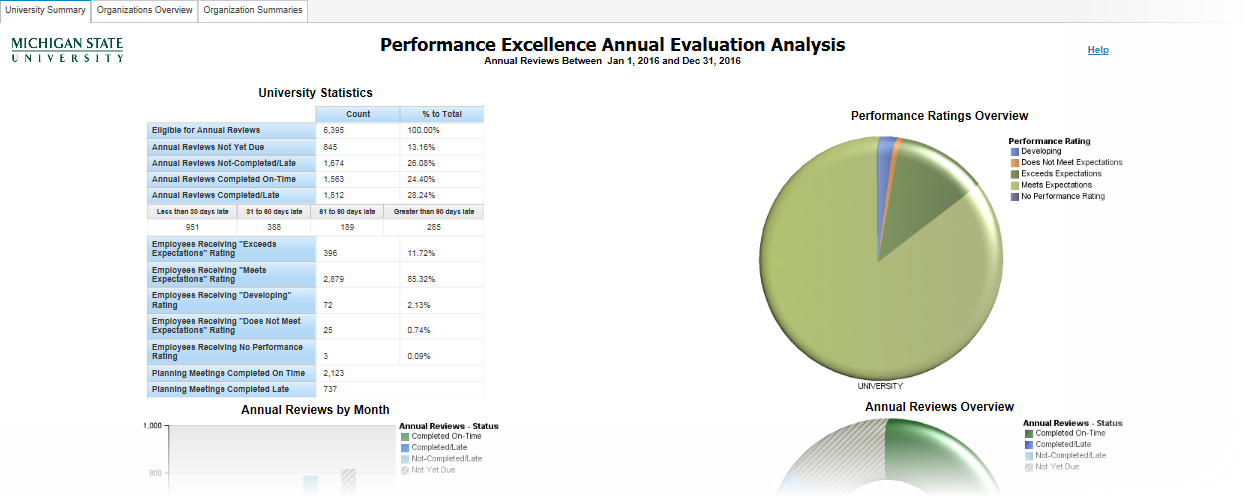
There are four sets of data representations showing overall university statistics for the date range selected on the prompt page.
- University Statistics: Table showing summary data regarding review statuses, performance ratings, and planning meetings completed.
- Performance Ratings Overview: Graphic representation of performance rating disbursement for the university during the date range identified in the prompt screen.
- Annual Reviews by Month: Color coded, graphic representation of reviews statuses by month.
- Annual Reviews Overview: Graphic representation of review statuses for the university during the date range identified in the prompt screen.