SUmmary page (HRP1093)
The Retirement Trends Analysis report (HRP1093) provides summary data of how many employees retired during the date range that was entered in the prompts.
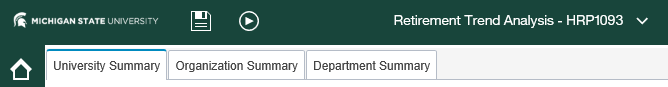
The summary data is provided in three different tabs in the upper left part of the page:
- University Summary
- Organization Summary
- Department Summary
Each tab will provide a summary chart(s) broken down into the different 5-year age groups represented by the colors in the legend and will provide the number of employees who retired during the selected date range, where applicable.
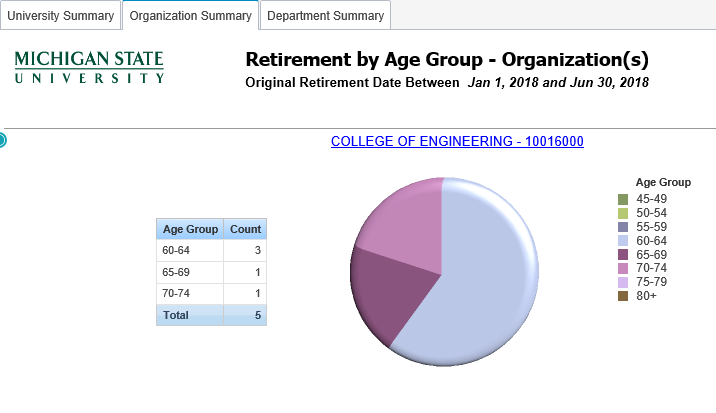
In the Organization Summary or Department Summary tab, you have the ability to "drill down" to view the detail report of the employees who have retired by selecting the highlighted organization/department name link. The summary tab will remain open in the same tab in which it was launched and can be accessed by navigating back to that tab.
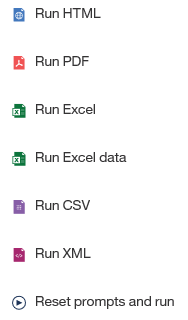
To have the report run in a different application (i.e. Excel, PDF, etc.), or to rerun the summary report with different criteria, select the drop-down menu arrow at the top left of the page and choose the appropriate action to run.