
Data Definitions - HRP1066
Data elements used in the Salary Comparison Report and displayed in the table below, are defined on this page.

- Pay Scale Level: The number level signifying range of possible pay assigned to the job title or classification.
- Job Title: The classification selected for the report.
- Average Full Time Equivalent (FTE) Salary: The average base salary of a full-time equivalent (FTE) employee, not including bonuses or commissions.
- Calculation used - Sum of all FTE salaries within the job title or classification, divided by the count of salaries in the job title or classification.
- Median Full Time Equivalent (FTE) Salary: The boundary between the highest paid 50% base salaries and the lowest paid 50% base salaries in the classification.
- The median is the middle value number in a data set.
- Ex: Data set is 3, 9, 15, 17, 44. Therefore, 15 is the median of this data set.
- If there is an even number in a data set, take the two middle numbers add them together and divide by 2.
- Ex: Data set is 3, 6 8, 12, 17, 44. Take 8 and 12 (two middle numbers) add them together and divide by two. (8 + 12) / 2 = 10. The median is 10.
- Minimum Full Time Equivalent (FTE) Salary : The lowest base salary of a full-time equivalent (FTE) employee, not including bonuses or commissions.
- Maximum Full Time Equivalent (FTE) Salary: The highest base salary of a full-time equivalent (FTE) employee, not including bonuses or commissions.
- Standard Deviation of Full Time Equivalent (FTE) Salary: The typical variation of salaries within the range of the job title or classification from the average (mean) or expected value. A high standard deviation indicates the classification salaries are spread out.
Example of Standard Deviation Calculation:
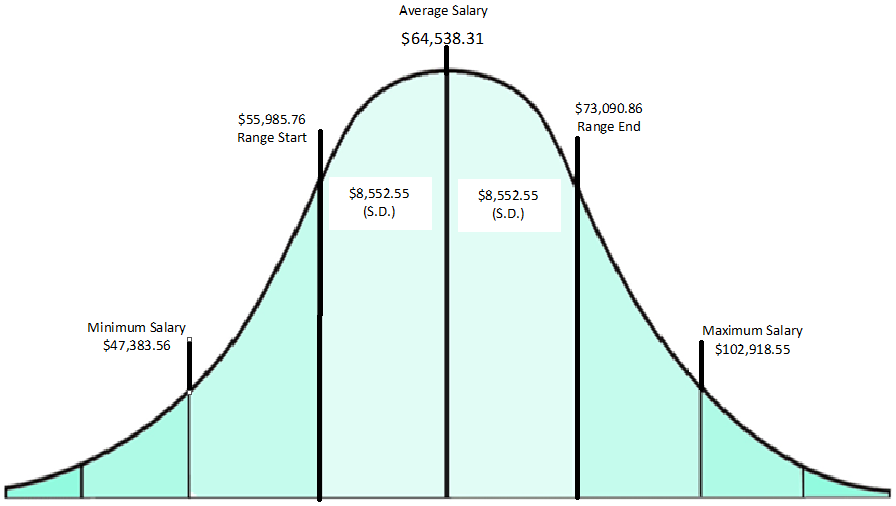
Ex: Bell Curve Graph
- The salary of $64,538.31 is the average salary in the Classification I classification.
- To understand where a salary lies within the job title or classification category, the range needs to be determined.
- To get the beginning of the range, subtract the Standard Deviation from the Average FTE Salary ($64,538.31 - $8,552.55 = $55,985.76).
- To get the end of the range, add the Standard Deviation to the Average FTE Salary ($64,538.31 + $8,552.55 = $73,090.86).
- The range of the Classification I begins at $55,985.76 and ends at $73,090.86.
- Any salary outside the range for the Classification I (lower than $55,985.76 or higher than $73,090.86) is considered an outlier of that job title or classification.
- Ex: The salary of $50,362.32 is an outlier because it is outside the beginning of the range.
- Average Years of Service: The average number of years the employees within the job title or classification has worked. This is based on an employee’s retirement eligibility date. When an employee is not benefit eligible and does not have a retirement eligibility date, they will show in the Year of Service category of “Benefit Ineligible Employee” on the report.
- Average Time in Level (Years): The average number of years the employees within the job title or classification have remained in the pay grade (scale) level.
- Total Incumbents: The number of employees within the job title or classification as of the date of the report.
- Full Time Equivalent (FTE) – Annual salary * 100 / Employment percentage.
- Ex: ($70,000.00 @ 100%) * 75% = $52,500.00
- Rose Chart: A Rose Chart can organize the data in a way that is congruent with the categorization of the data — such as periodic time, phase or directional categories.